
How to Use Exits and Engagement Rate in GA4 and Looker Studio
- Oleh Nesterenko
- Feb 9
- 3 min read

Updated: Feb 9
In Google Analytics 4 (GA4), event-driven tracking has replaced the traditional page-based tracking model. As a result, “Exits” are no longer a standard metric in GA4 and, consequently, in Looker Studio. However, I still prefer using both Exit Rate and Engagement Rate to gain deeper insights into user behavior.
Combining these two metrics, I can understand which pages perform well and which need optimization.
Understanding Exit Rate
The exit rate is no longer a built-in metric in GA4. However, we can estimate it using Looker Studio.
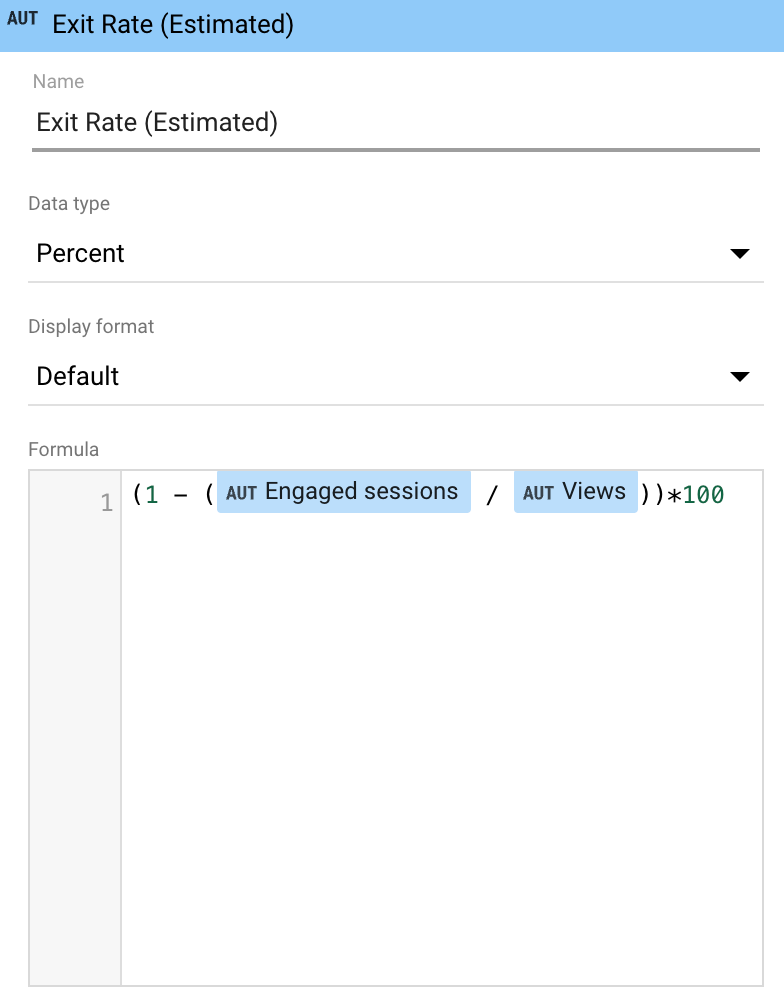
An Exit occurs when a user leaves the website from a specific page—meaning that this was the last page viewed in the session. Since GA4 does not provide Exits as a default metric, I use this custom formula in Looker Studio to estimate the Exit Rate:
Exit Rate = (1 - (Engaged sessions / Views)) * 100
This calculation determines the percentage of non-engaged page views, helping us analyze which pages experience high drop-offs.
How to Interpret Exit Rate?
High Exit Rate on Important Pages → May indicate UX issues, weak content, or a poor call-to-action (CTA).
High Exit Rate (for example, on a Thank You Page) → Likely natural, as the user has completed an action.
Low Exit Rate on a Homepage → Might be good or bad, depending on whether users are navigating deeper into the site or just lingering without action.
To reduce the Exit Rate, you should consider enhancing page content (to ensure it aligns with search intent), adding CTAs, and improving internal linking to encourage users to explore further.
Engagement Rate in GA4: The Key to Understanding User Interaction
Engagement Rate is one of the most critical metrics in GA4 because it directly measures meaningful user interactions.
GA4 automatically calculates the Engagement Rate using the formula:
Engagement Rate = (Engaged Sessions / Total Sessions) * 100
Let me remind you that Engaged Session means that a user either stays more than 10 seconds on the page, views at least two pages, or triggers a conversion event.
So, a high engagement rate means that users will find the website valuable and interactive. It strongly indicates effective content, good UX, and visitor intent.
How can we improve the engagement rate? Enhancing UX, engaging content, and encouraging conversions through better CTAs or internal linking will keep users exploring more pages on the website.
Combining Exit Rate & Engagement Rate for Better Insights
Analyzing Exit Rate and Engagement Rate together gives me a complete picture of how users interact with my site.
Four Key Scenarios & What They Can Mean
Exit Rate | Engagement Rate | Interpretation |
High Exit Rate + Low Engagement Rate | Worst Case! Users leave without interacting. | Improve content, CTAs, page speed, and usability. |
High Exit Rate + High Engagement Rate | Often Natural. Users leave after completing an action. | Check if the exit happens after conversions or key interactions. |
Low Exit Rate + Low Engagement Rate | Users are staying but not engaging. | Add engaging elements like videos, quizzes, and strong CTAs. |
Low Exit Rate + High Engagement Rate | Ideal Scenario! | Maintain and further optimize top-performing pages. |
How do you create a report in Looker Studio to display both the Exit and Engagement rates?
You should create a table or a chart in the Looker Studio to display both Exit and Engagement rates.
As a Dimension, you should use Page Path.
As a Metric, you should use the Engagement Rate (already available) and create a custom metric for the estimated Exit Rate (use the formula that I wrote above: Exit Rate = (1 - (Engaged sessions / Views)) * 100).
In the end, you will get this table:

All the best with your analysis and following action!

